Don't just free your data, Swivel it
Admit it. You love visualizing data. Mere tables do nothing for you, but the minute you can turn that into a map (or a graph or chart), information comes alive.
I was recently turned on to Swivel, a website that allows you to upload, visualize, and share data. The main page provides a list of some of the more recent data collections and, like so many great websites, my response to many of those graphs was interest piqued that I never knew I had.
I looked into the process of getting data on Swivel, and saw that one of the ways of uploading data was via a hosted CSV file. And this was noteworthy, since with the release of GeoServer 1.7.3, CSV is newly available as an output format.
So, thinking of our perennial favorite, the topp:states layer (USA Population), I found my hosted version of GeoServer 1.7.3, and built the following request:
http://MYGEOSERVER/wfs?service=wfs&request;=GetFeature&typename;=topp:states&outputformat;=csv
As a refresher (or for those whose eyes glaze over at long GET requests), let’s briefly go over this:
**service=wfs** - Specifies a WFS request, so we should be getting back XML, not images. **request=GetFeature** - Asks for actual feature data from a layer, as opposed to information about that data (like in a GetCapabilities request). **typename=topp:states** - This specifies the layer to apply the request to, in this case, "topp:states", the "Hello World" of GeoServer. **outputformat=csv** - This specifies the CSV output format.
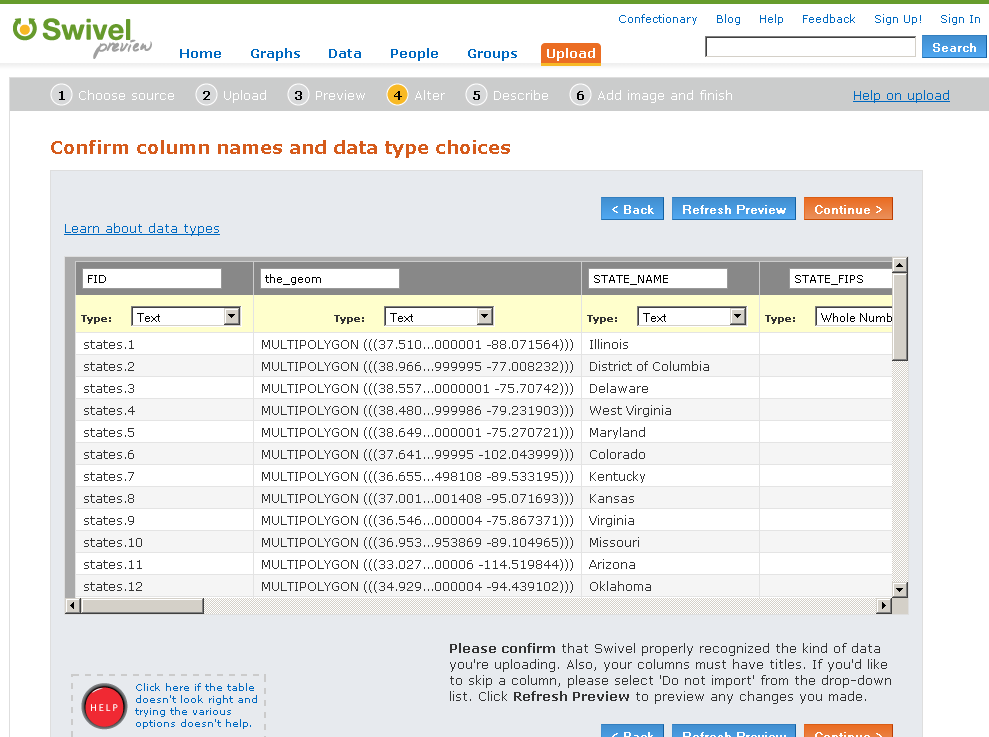
Anyway, I flexed my fingers and pasted the above link into Swivel’s upload page. In a few seconds, Swivel returned with a preview of the tabular data, to make sure that it was uploaded correctly (and to check things like delimiters and titles).

Swivel appears to have gotten everything right on the first try, so I continued on. Next it asked me about title names, and to verify the data types on the columns (text/numbers/etc).
Once again, Swivel appears to have needed no steering. The next page asked for information about the data set. (And I know when adding layers to GeoServer, we never skip this step, and always fill out the Name/Title/Abstract, right?)

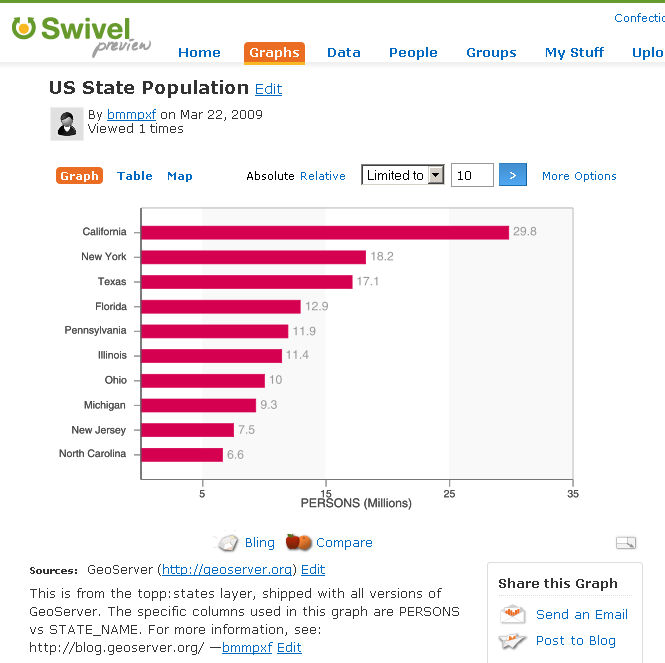
Then came to obligatory signup page (a smart thing to put at this step and not at the beginning, I might add) and then a long wait. Finally, I was presented with the ability to decide which columns to set as the graph. I wanted to go for public transit usage as a function of total population (basically a graph of PUBTRANS/PERSONS vs. STATE_NAME) but Swivel didn’t provide for mathematical operations that I could find, , so I contented myself with a simple population graph.
The small point to make is that GeoServer can natively interact with many different applications, often in whimsical and unexpected ways. The larger point is that our data is more than just dots on a map. A robust data set, full of attributes and good metadata, can tell us stories, and the visualizations make the stories come alive. After all, it’s the story that’s really important, not the data, when it comes down to it.
(If you link up your GeoServer to Swivel and come up with some nifty visualizations, please send us the links, so we can see what you’re up to!)