Powerful SLD Styles & Filters in GeoServer
GeoSpatial Techno is a startup focused on geospatial information that is providing e-learning courses to enhance the knowledge of geospatial information users, students, and other startups. The main approach of this startup is providing quality, valid specialized training in the field of geospatial information.
( YouTube | LinkedIn | Facebook | X )
Powerful SLD Styles and Filters in GeoServer
In this session, we’ll explore GeoServer SLD styles and filters and highlight their practical and versatile uses. If you want to access the complete tutorial, click on the link.

Introduction
Filters in GeoServer are essential for controlling map data display, allowing users to set conditions for data inclusion. By integrating these filters into a Styled Layer Descriptor (SLD), users can customize maps based on specific attribute values or spatial areas. This customization enables the creation of visually informative and meaningful maps that effectively showcase data.
Several types of filters can be used in GeoServer styling, such as Comparison operators , Spatial operators , Logical operators and Arithmetic operators.
Note. This video was recorded on GeoServer 2.22.4, which is not the most up-to-date version. We encourage all users to use the stable series, currently 3.0.x. To ensure you have the latest release, please visit this link and avoid using older versions of GeoServer.
Note. In all examples in this blog post, we utilize the topp:states layer.
Comparison Operators
These operators allow users to filter data by focusing on non-spatial attributes of a feature, selecting specific values within a field, or defining a range of values. This functionality helps refine search results within a dataset for more precise data analysis.
The Comparison operators include: Binary comparison operators and Value comparison operators.
The binary comparison operators are: PropertyIsEqualTo , PropertyIsNotEqualTo , PropertyIsLessThan , PropertyIsLessThanOrEqualTo , PropertyIsGreaterThan and PropertyIsGreaterThanOrEqualTo.
To learn how to use various filters for creating a custom SLD style in GeoServer, follow these steps:
- Navigate to the Styles page from the Data section, then click on Add a new style link.
- In the Name field, type your desired name, such as
Comparison_lessThan. - Select Polygon from the list of default styles, then click the Generate link.
-
Type the new title on line 13, and press the ‘Enter’ key at the end of the line. Then, add the following block codes to the new line:
<ogc:Filter> <ogc:PropertyIsLessThan> <ogc:PropertyName>PERSONS</ogc:PropertyName> <ogc:Literal>1000000</ogc:Literal> </ogc:PropertyIsLessThan> </ogc:Filter> - Press the Validate button to check if you have misspelled anything. If there are no errors, press the Apply button.
- Switch to the Layer Preview tab and click the layer name above the preview box and select
topp:stateslayer.
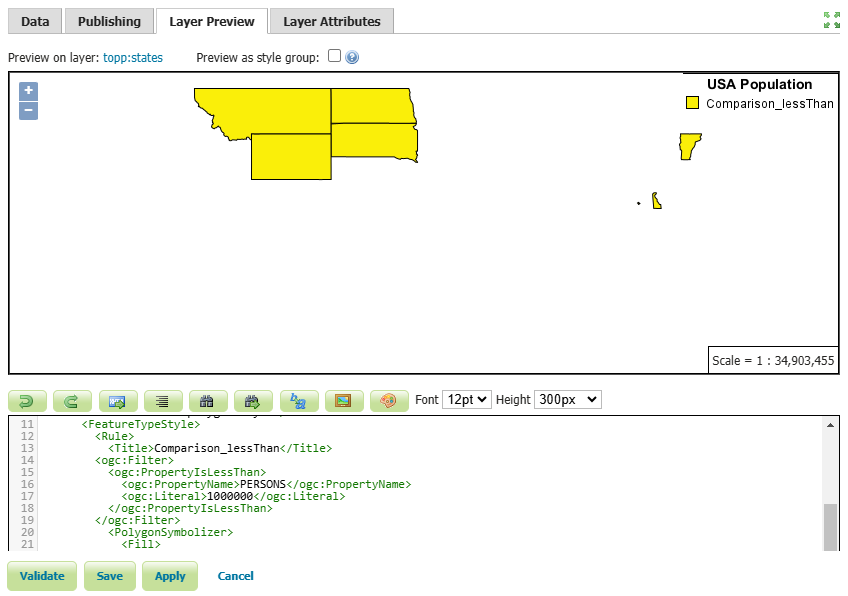 In this example, we have created a style for states with a population of less than one million.
- Press the Save button.
Other available comparison operators, known as the value comparison operators include: PropertyIsLike , PropertyIsNull, and PropertyIsBetween.
To use the PropertyIsLike operator in a new style, follow these steps:
-
Click on Add a new style link, then enter
Comparison_likein the Name field. -
Select Comparison_lessThan from the existing styles, then click the Copy link.
-
To filter the states that include
newin their name, modify the existing codes using the following codes:<ogc:Filter> <ogc:PropertyIsLike wildCard="%" singleChar="_" escape="!"> <ogc:PropertyName>STATE_NAME</ogc:PropertyName> <ogc:Literal>%new%</ogc:Literal> </ogc:PropertyIsLike> </ogc:Filter> -
Additionally, insert the following block of code on line 30 to display the names of the states as well.
<TextSymbolizer> <Label> <ogc:PropertyName>STATE_NAME</ogc:PropertyName> </Label> <VendorOption name="maxDisplacement">50</VendorOption> </TextSymbolizer> -
Press the Validate button to check if you have misspelled anything. If there are no errors, press the Apply button.
-
Switch to the Layer Preview tab and click the layer name above the preview box and select
topp:stateslayer.
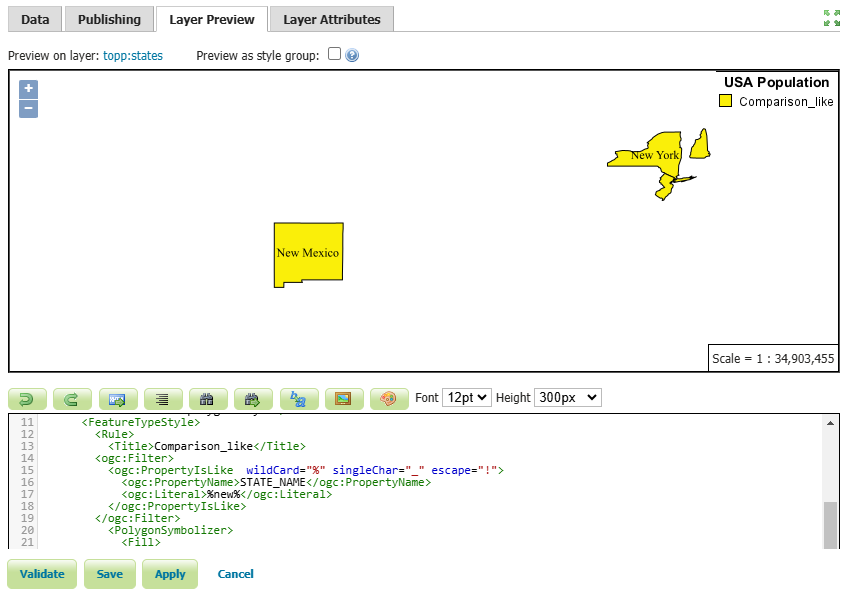
In this example, we filtered the states that have the word new in their name, such as: New York , New Jersey , New Hampshire and New Mexico.
- Press the Save button.
Spatial Operators
These operators allow users to filter data based on its spatial location. This can include filtering data based on its proximity to a specific point, within a specific area or boundary, or in relation to other spatial features.
Some common spatial operators include: Within , Contains , Intersects , BBOX , etc. For a comprehensive list of all the spatial operators, please visit this link
Follow these steps to use the Intersects filter in a new style:
- Click on Add a new style link, then enter
spatial_intersectsin the Name field. - Select
comparison_likefrom the existing styles, then click the Copy link. -
Edit the codes using the following codes:
<ogc:Filter xmlns:gml="http://www.opengis.net/gml"> <ogc:Intersects> <ogc:PropertyName>the_geom</ogc:PropertyName> <gml:LineString> <gml:coordinates>-112.5,34.7 -106.8,36.7 -100.5,36.8 -97.4,42.4</gml:coordinates> </gml:LineString> </ogc:Intersects> </ogc:Filter> - Press the Validate button to check if you have misspelled anything. If there are no errors, press the Apply button.
- Switch to the Layer Preview tab and select
topp:stateslayer.
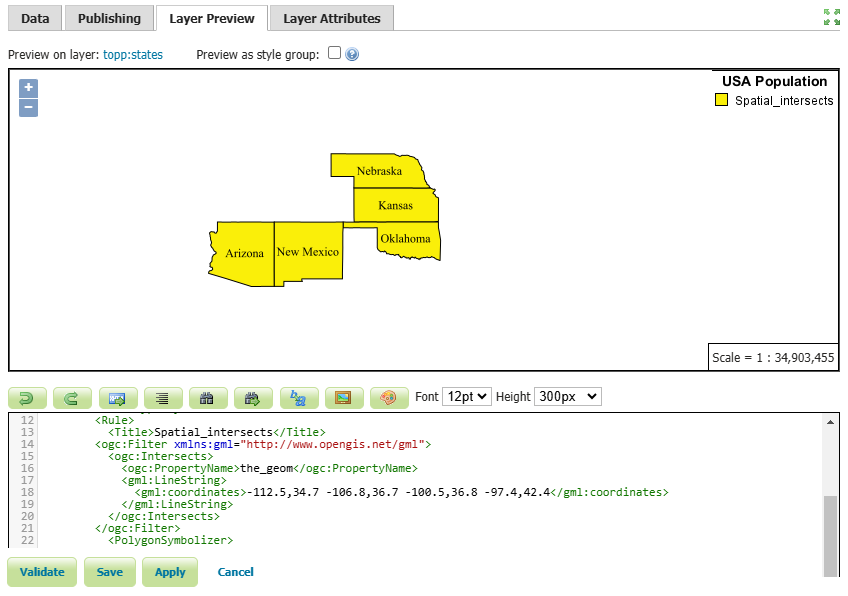
The states that intersect with a LineString, determined by the specified coordinates, include Arizona, New Mexico, Oklahoma, Kansas and Nebraska.
- Press the Save button.
Logical Operators
Logical operators are used to set conditions for applying specific style rules to features. They allow users to create complex rules based on various attributes and conditions. In GeoServer, the key logical operators are AND, OR, and NOT.
- AND: Both specified conditions must be true for the style rule to be applied.
- OR: At least one of the specified conditions must be true for the style rule to be applied.
- NOT: The style rule will not apply to features that do not meet the specified condition.
Here’s an example of how to use the AND operator to filter a SLD based on two conditions.
-
Click on Add a new style link, then enter
logical_andin the Name field. -
Select
spatial_intersectsfrom the existing styles, then click the Copy link. -
Edit the codes using the block codes below:
<ogc:Filter xmlns:gml="http://www.opengis.net/gml"> <ogc:And> <ogc:BBOX> <ogc:PropertyName>the_geom</ogc:PropertyName> <gml:Box> <gml:coord> <gml:X>-105</gml:X> <gml:Y>35</gml:Y> </gml:coord> <gml:coord> <gml:X>-90</gml:X> <gml:Y>45</gml:Y> </gml:coord> </gml:Box> </ogc:BBOX> <ogc:PropertyIsBetween> <ogc:PropertyName>PERSONS</ogc:PropertyName> <ogc:LowerBoundary> <ogc:Literal>3000000</ogc:Literal> </ogc:LowerBoundary> <ogc:UpperBoundary> <ogc:Literal>5000000</ogc:Literal> </ogc:UpperBoundary> </ogc:PropertyIsBetween> </ogc:And> </ogc:Filter> - Press the Validate button to check if you have misspelled anything. If there are no errors, press the Apply button.
- Switch to the Layer Preview tab and select
topp:stateslayer.
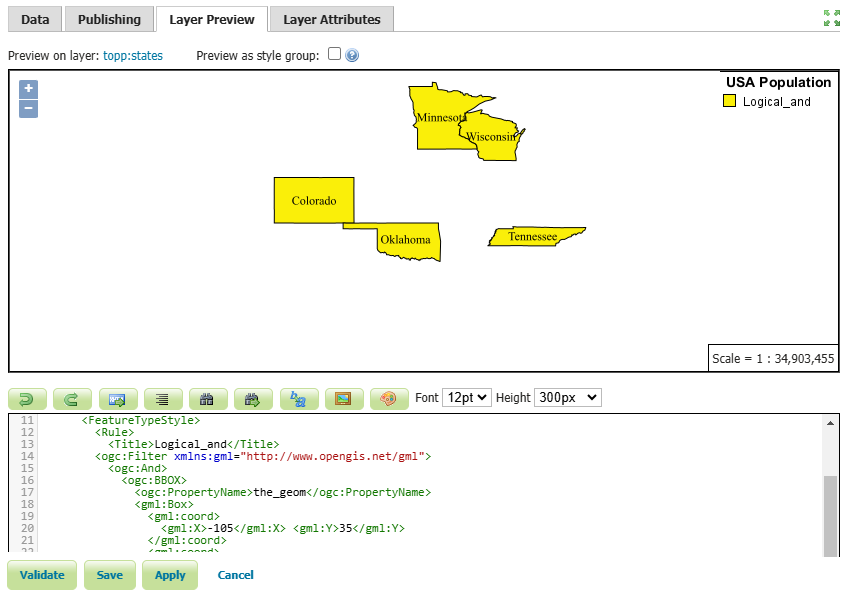
In this example, the states that intersect a certain bounding box and have a population between 3 million and 5 million have been filtered. The states that meet these criteria are Colorado, Oklahoma, Tennessee, Minnesota and Wisconsin.
- Press the Save button.
Arithmetic operators
Arithmetic operators enable users to create custom visualizations through mathematical equations and expressions, allowing them to effectively convey their data visually on maps.
The available arithmetic operators include: Add , Sub , Mul and Div.
For example, you can use arithmetic operators to create a proportional symbol map, where the size of point symbols is based on a numeric attribute value. By dividing the attribute value by a constant factor, you can control the size of the symbols accordingly.
Here’s an example of how to use this operator in GeoServer:
-
Click on Add a new style link, then enter
arithmetic_divin the Name field. -
Select Polygon from the list of default styles, then click the Generate link.
-
Enter the following code snippet on line 26:
  <Rule>
    <Name/>
    <Title>PERSONS Symbol</Title>
    <PointSymbolizer>
      <Geometry>
        <ogc:Function name="centroid">
          <ogc:PropertyName>the_geom</ogc:PropertyName>
        </ogc:Function>
      </Geometry>
      <Graphic>
        <Mark>
          <WellKnownName>circle</WellKnownName>
          <Fill>
            <CssParameter name="fill">#FF0000</CssParameter>
          </Fill>
          <Stroke>
            <CssParameter name="stroke">#000000</CssParameter>
            <CssParameter name="stroke-width">1</CssParameter>
          </Stroke>
        </Mark>
        <Size>
          <ogc:Div>
            <ogc:PropertyName>PERSONS</ogc:PropertyName>
            <ogc:Literal>1000000</ogc:Literal>
          </ogc:Div>
        </Size>
      </Graphic>
    </PointSymbolizer>
  </Rule>
In this example, we have defined two rules. The first rule is to display the simple polygons representing the states, while the second rule is to create circular symbols based on the population of each state.
We used the Centroid function to assign a symbol to each state, and place it exactly in the center of each polygon. In addition, we divided the Persons attribute by one million to ensure a proportional representation of the symbol size to the polygons.
-
Press the Validate button to check if you have misspelled anything. If there are no errors, press the Apply button.
-
Switch to the Layer Preview tab and select
topp:stateslayer.
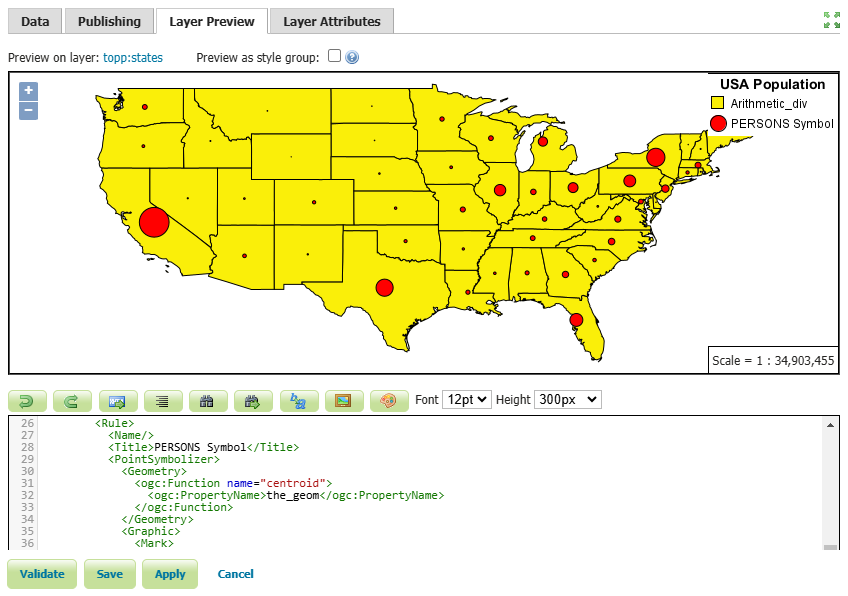
As you can see, we have scaled the point size based on the PERSONS attribute. This makes the symbol larger for larger population values like California, New York and Texas and the symbol smaller for smaller population values like Wyoming.
- Press the Save button.
In this session, we took a brief journey to explore SLD styles and various filters in GeoServer. If you want to access the complete tutorial, click on the link.