Master GeoServer WPS - Buffer & Intersection Analysis
GeoSpatial Techno is a startup focused on geospatial information that is providing e-learning courses to enhance the knowledge of geospatial information users, students, and other startups. The main approach of this startup is providing quality, valid specialized training in the field of geospatial information.
( YouTube | LinkedIn | Facebook | X )
Master GeoServer WPS - Essential Buffer & Intersection Analysis Techniques!
This blog post provides how to use the Buffer and Intersection analysis in the WPS Request Builder. The WPS Request Builder is a demo page used to try out the Web Processing Service (WPS) used to execute geospatial processes for transformation, summary and analysis.
If you want to access the complete tutorial, click on the link.
Introduction
Buffer analysis is a crucial process in Geographic Information Systems (GIS). It involves creating a zone around geographic features — such as points, lines, or polygons — to analyze spatial relationships and proximity. This type of analysis has various applications, including determining influence areas, assessing environmental impacts, and evaluating accessibility. It provides insights for decision-making in fields such as Urban planning, Natural resource management, and Emergency response planning.
In GeoServer, users can create buffer zones around geographic features by specifying the input geometries and the buffer distance. This functionality is part of the GeoServer WPS extension, which provides a standardized interface for various geospatial processing algorithms.
To create buffers in GeoServer, navigate to the Demos section and select the WPS Request Builder option. In the Choose Process section, type buffer to see a list of available buffer related process. As you can see, GeoServer has six such processes.
As mentioned in our previous blog post, the JTS and geo processes do not directly access to the GeoServer layers. Instead, these processes utilize external libraries, specifically the Java Topology Suite (JTS) and GeoTools.
JTS:buffer
- From the list, select JTS:buffer. This operation requires three inputs for execution:
Text,Reference, andSubProcess.
In the text mode, you need to enter the geometry data in a standard formats For this example, use the application/wkt as the input format, and enter the geometry data:
POINT(-100 50)
- Enter the buffer distance in the Distance textbox. This parameter defines the size of the buffer created around the input feature and is represented as a double data type. In this case, enter
0.1degrees, which is based on EPSG:4326 coordinate system.
Note: The distance value is mandatory and corresponds to the geometric units being used.
-
Choose your desired output format from the Process Outputs section. This enabled you to select the most appropriate format for your specific usecase or workflow. The result can be further processed, visualized, or used for additional spatial analysis. The available formats include: application/wkt , application/json.
-
Select the application/wkt format and press the Execute process in New Page button.
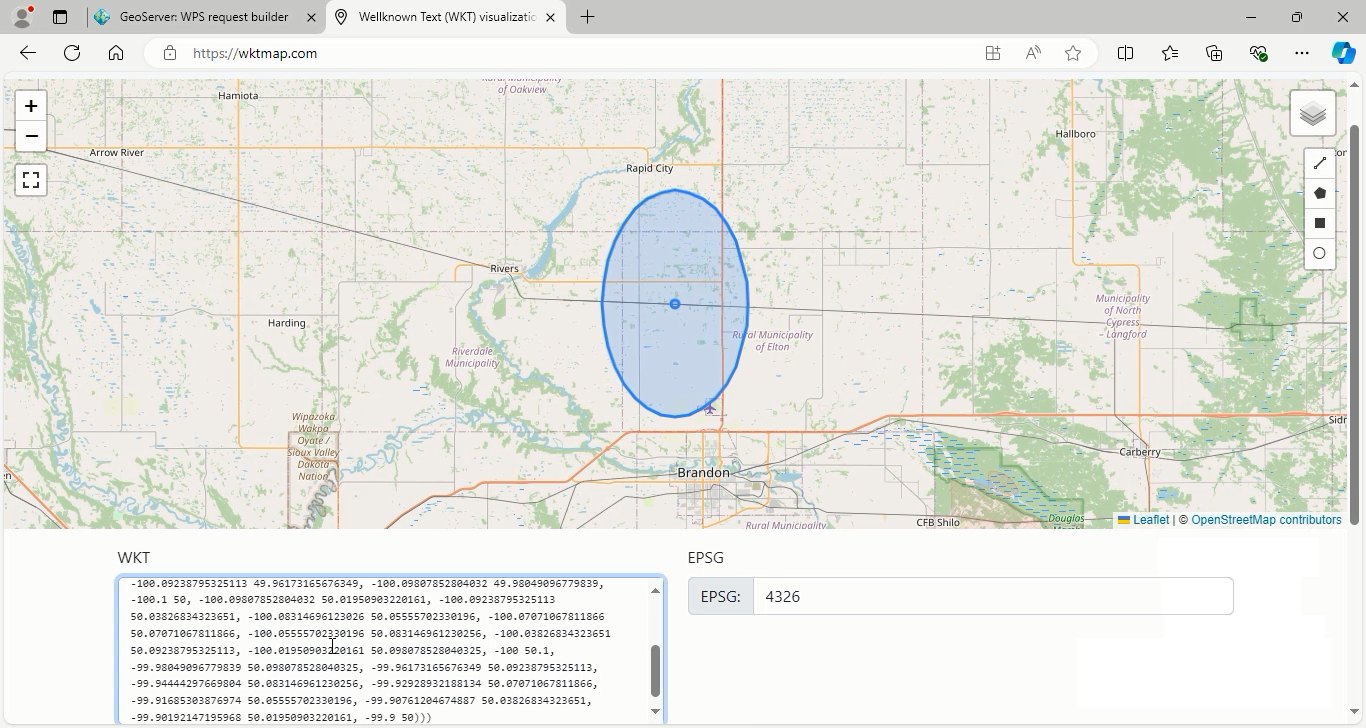
Now that you have executed the buffer operation, you can view the results. Navigate to WKT Map and enter the resulting geometries in the WKT textbox to visualize the buffer created around the specified point.
Go back to geoserver software to explain other parameters:
-
The quadrantSegments parameter in the JTS:buffer, is an optional parameter for shaping quarter-circle buffers. Increasing its value enhances the buffer’s smoothness and circularity but also raises vertex count, which can affect performance.
-
The default is 8 segments, which create 32 sides that are more circular than the others. It’s important to balance precision with processing efficiency, as a higher value improves curve quality but increases computational complexity.
-
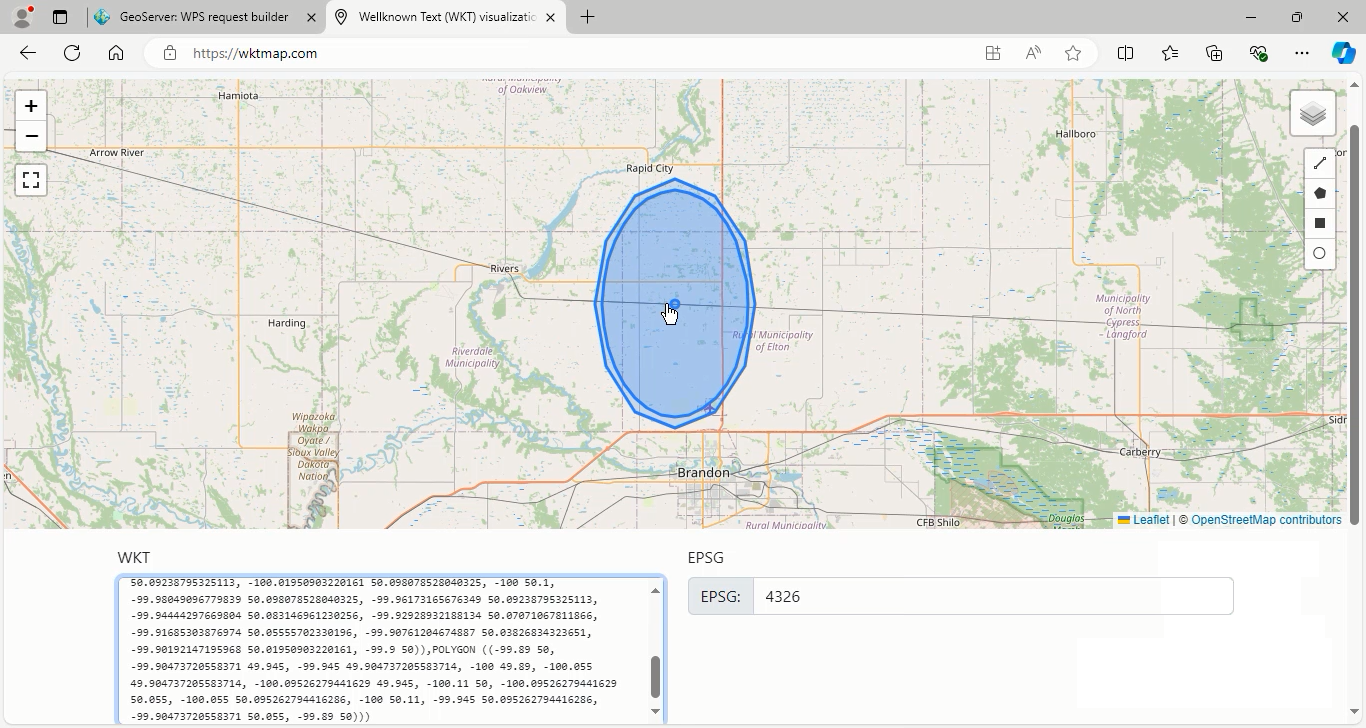
Set the distance buffer to
0.11and quadrantSegments to3, then press the Execute process in New page. Now see the resulting shape. Note that the distance value is measured in units provided by coordinate reference system (not in pixels).
As you can see, the result is somewhat circular due to the smaller number of sides.
Go back to geoserver again to explain the last parameter, capStyle.
-
The capStyle is an optional parameter that specifies the type of cap style used at the ends of buffer polygons. There are three available options: Round, Flat, and Square.
- Round: This is the default option, which creates a rounded appearance at the ends of a buffer around a line feature.
- Flat: This option creates clean and straight ends.
- Square: This option creates a more pronounced squared-off effect.
By selecting the appropriate cap style, you can customize the appearance of your buffer areas according to your visualization needs.
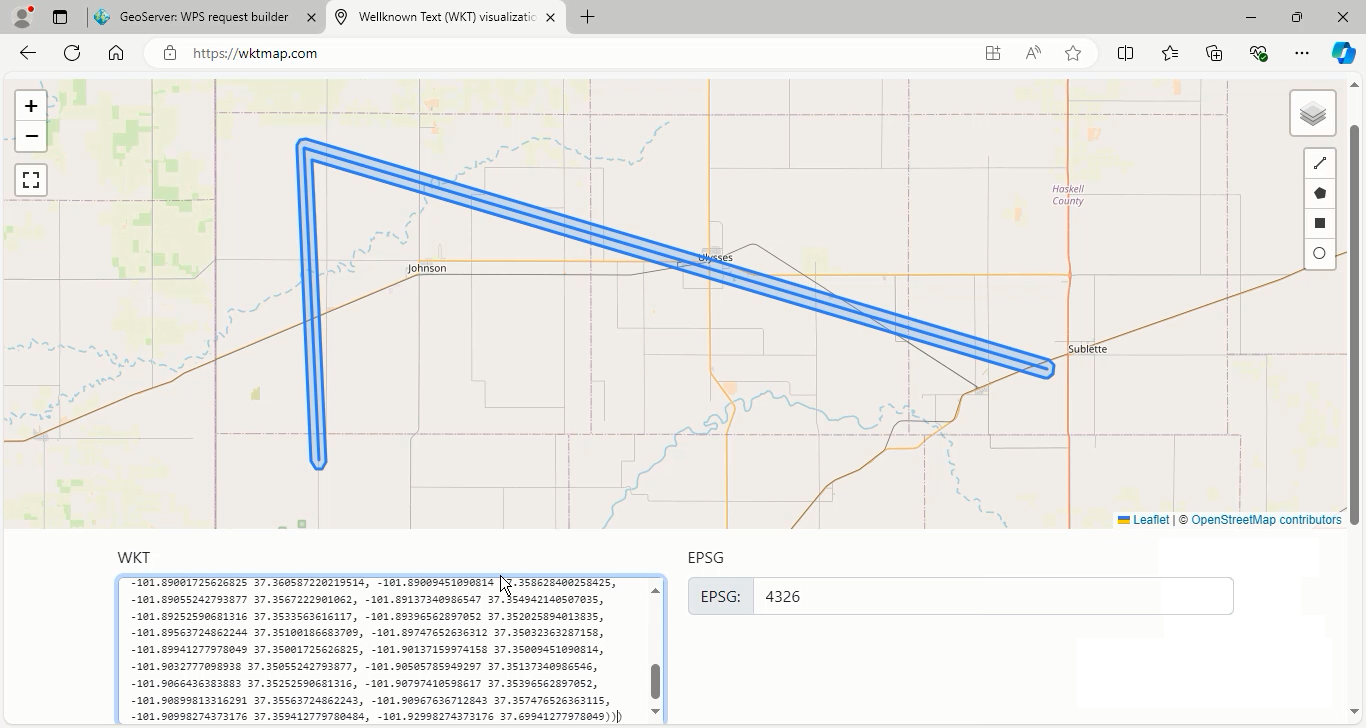
- To use the capStyle option, enter the geometry data in the application/wkt format.
- Geometry data: LINESTRING (-101.9 37.36, -101.92 37.7, -100.9 37.46)
- Distance value: 0.01
Press the Execute process in New page button. Repeat this process for the Flat and Square cap styles and then view the results.
GS:BufferFeatureCollection
This function utilizes the GeoTools library to process feature collections by generating buffered geometries around each feature. Users can specify the buffer distance as either a fixed value or dynamically based on a specific field’s value.
The first input parameter is the InputFeatureCollection, which can accept four types of input: Text, Reference, subprocess, and vector_layer. The default option is the vector layer.
For this example, we will use the archsites layer from GeoServer. Select this layer from the Choose one drop-down menu.
We will first apply a fixed value for the buffer distance parameter, followed by using a specific field to dynamically adjust the buffer distance.
Fixed Value Buffering
- Enter a distance value suited to the coordinate reference system (CRS) of the layer. As the
archsiteslayer uses the UTM crs, you can set a value like20.
Note: Filling this parameter is mandatory.
-
Once the input features and distance have been defined, choose the output format for displaying the results of the buffering operation.
-
Select the application/zip format from the Process Outputs section, and then press the Execute process in New Page button.
After the process is complete, open the result file using QGIS software. You will see that buffer areas of 20 meters have been created around each feature.
Dynamic Value Buffering
-
To use a specific field for buffer distance, first, enter a
zerovalue in the mandatory distance box, then specify the attribute name that contains numerical values for the buffer distances. -
In this example, we will use the
catattribute. -
Again, choose the application/zip mime-type for the output file format and press the Execute process in New Page button.
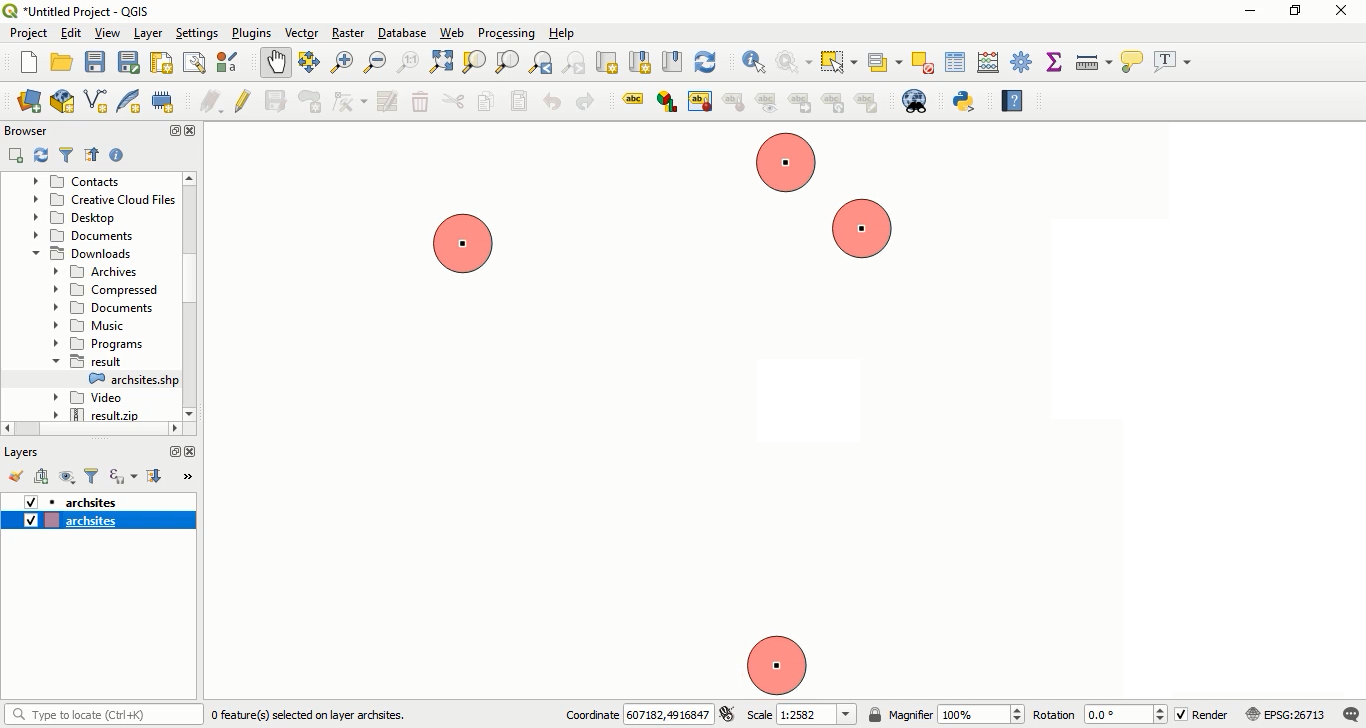
After processing is complete, add the resulting file to QGIS software. As you can see the buffer areas around each feature have different distances based on the values found in the cat field.
Intersection analysis
Intersection analysis is a crucial spatial technique used in GIS to explore and understand the relationships between various geographic features or datasets. This method focuses on examining how different data layers overlap and interact, which provides valuable insights for decision-making processes in areas such as urban planning, environmental management, and resource allocation.
In GeoServer, Intersection analysis facilitates the identification of overlapping areas between features from two distinct datasets. This operation can be efficiently implemented through the WPS request builder, making spatial analysis both effective and user-friendly.
To carry out an intersection analysis, select gs:IntersectionFeatureCollection from the Choose process menu.
-
The first and second feature collections, serve as the main input features and are considered mandatory parameters for this process. Other parameters are optional.
-
For this example, choose
sf:streamsas the first feature collection andsf:restrictedas the second feature collection. -
Select the application/json format from the Process Outputs section, then press the Execute process in New Page button.
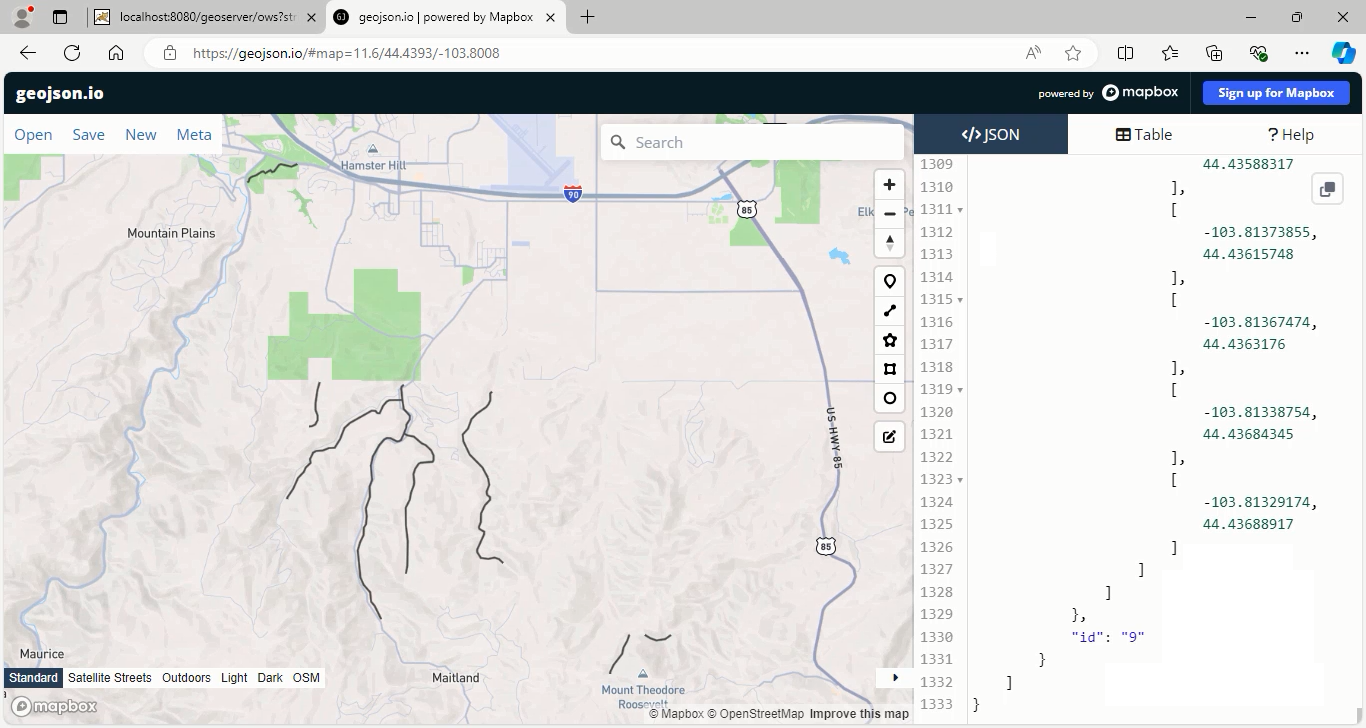
After execution, you can view the results by navigating to geojson.io and entering the resulting geometries in the textbox provided.
Go back to geoserver software to explain other parameters:
The intersection analysis also allows you to specify which attributes from the input feature collections should be retained in the output. If this selection is not made, all fields from each layer will be included by default.
- In this example, enter
labelto retain this specific field from the first layer.
IntersectionMode: This parameter allows users to specify how to handle the intersection of two feature collections. By choosing between the Intersection, First, and Second options, users can tailor the results to fit their specific spatial analysis needs.
Let’s describe each of them:
-
Intersection: This is the default option, which includes only the features that geometrically overlap between the two input collections. Only areas where both inputs intersect will be represented in the output.
-
First: This mode filters the first feature collection by retaining only those features that intersect with any feature from the second collection. Features in the first collection without any intersection will be excluded from the output.
-
Second: This mode outputs features from the second collection, retaining only those that intersect with any feature from the first collection.
-
For this example, we select the First option in the intersectionMode parameter.
To view the results and incorporate the resulting geometries into QGIS, press the Execute process in New Page button again. The output will consist only the streams_label field from the first layer.
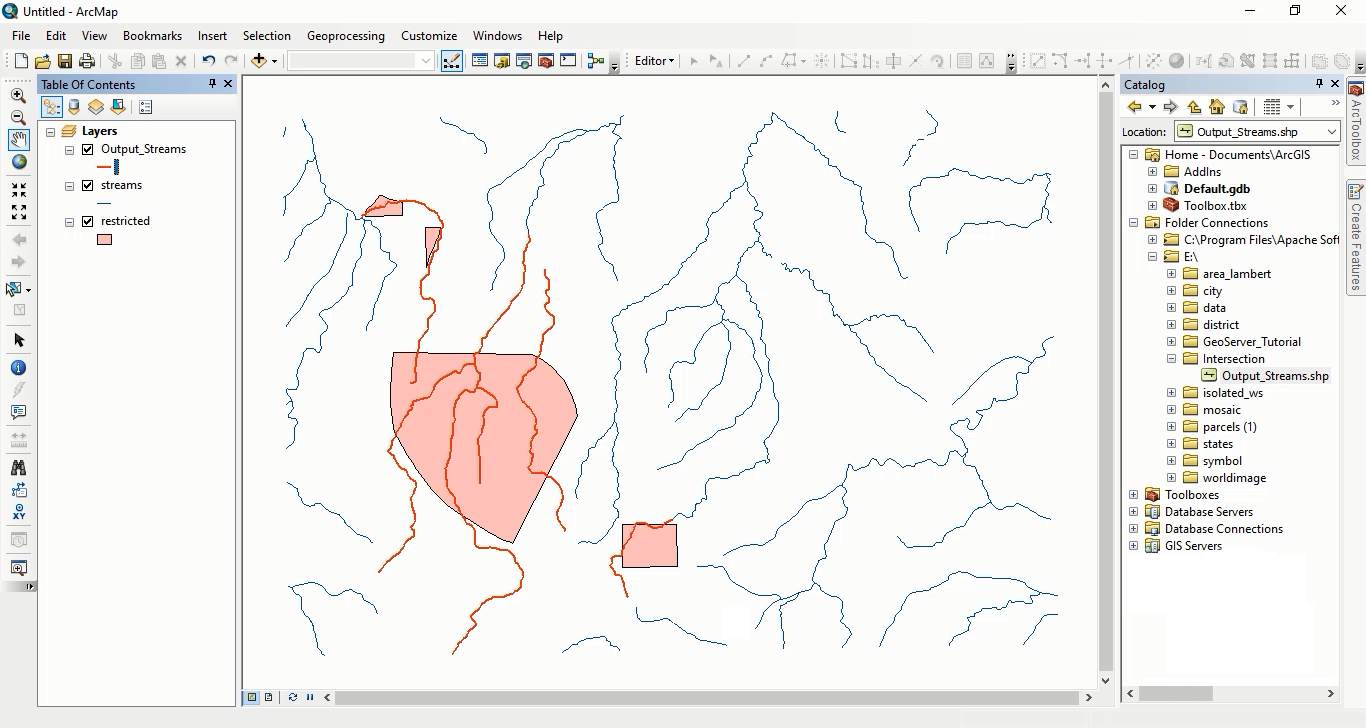
This means that the output features will only include those from the first collection that intersect with features in the second collection.
Additionally, the analysis includes two boolean options that determine if additional area attributes are included in the output:
-
percentagesEnabled: When set to true, this option includes attributes indicating the percentage of each feature’s area relative to the total area of each respective input feature collection. By default, this option is set to false.
-
areasEnabled: Similar to the percentagesEnabled mode, this option when enabled or set to true, includes attributes representing the area of each feature in the intersection. Its default setting is also false.
By carefully defining the parameters and choosing the appropriate options, users can effectively perform intersection analysis in GeoServer and generate meaningful spatial insights.
In this session, how to use the Buffer and Intersection analysis in the WPS Request Builder. To access the full tutorial, click on this link.