GeoServer Blog
New Windows Installer
Update: As of GeoServer 2.0.1, the legacy installer has been merged into the new installer. This means that during installation, you now have a choice on whether to install GeoServer as a Windows service or to run it manually.
GeoServer has provided a Windows installer for the past 4 years (since at least version 1.2.4, if not before). It has always been simple and functional, providing a modest wrapper for the Jetty container found in the binary distribution.
However, there are a number of ways in which GeoServer works in this environment that could be more in the spirit of Windows. So, with the release of GeoServer 1.7.5, we have redesigned the way GeoServer integrates with Windows, in the form of a new installer.
This new installer offers a host of new user-friendly features. First of all, GeoServer now shows up as a Windows service, in line with other server software such as Apache HTTP Server or PostgreSQL . This alleviates the need to have a command line window persist on the desktop when running GeoServer. Integration with Windows Services allows administrators the ability to automate the management of GeoServer, although starting and stopping GeoServer is also still possible from the Start Menu as before.
GeoServer now appears on the Add/Remove Programs list. It was always possible to uninstall via the Start Menu, but the uninstall option is now in a place where more users will expect it to be.
The installer itself has been redesigned as well. It now allows you to link to an existing data directory (if you have previously created one). Also, it allows (and encourages) you to change the username and password for the web administration interface, a feature unique to this installer. (In all other cases, it is necessary to edit the users.properties file.)
There are other some other user-friendly features added, such as the requirement (and check) for administrator rights to run the installer, to prevent errors during the install process.
Since this installer is very new and has not been tested on all platforms, we have included a link to the legacy installer that functions just like previous versions. But we encourage everyone to try out the new installer (and provide feedback on what works and what doesn’t) so that we can make the experience better. All in all, we feel that this is a marked improvement in the GeoServer Windows experience. Enjoy.
Ahora tenemos un grupo de discusión para la comunidad hispano-hablante
Here’s a quick announcement for all those who understand the above: GeoServer now has a Spanish language users mailing list! Created and moderated by core GeoServer developer Gabriel Roldán, the mailing list is a resource for those who would like assistance in all things GeoServer, but prefer to discuss in Spanish. This marks the fourth language for which GeoServer has a mailing list (the others being English, Portugese, and Italian).
En respuesta a la creciente demanda de información e ímpetu de colaboración de usuarios de habla hispana, hemos creado un grupo de discusión para la comunidad hispano-hablante donde puedes comunicarte con otros usuarios de GeoServer en español y discutir cualquier tema relacionado con el proyecto. Si quieres involucrarte activamente en el desarrollo de GeoServer puedes inscribirte en la lista de desarrolladores (en inglés).
We’re also looking for users to contribute documentation in Spanish, así que si quieres ayudar a escribir documentación en español dejanos saber.
GeoServer 1.7.5 Released
The GeoServer Team is happy to announce the the release of GeoServer 1.7.5, the sixth stable version in the 1.7 series.
This release contains some new features that are designed to improve the use of GeoServer in a production environment. Some new WMS settings have been added that allow the administrator to limit the amount of resources consumed by each WMS request, specifically in terms of memory and time used. It is also now possible to use JNDI connection pools for the DB2 and Oracle (NG) databases, providing better integration with enterprise environments.
The features pregeneralized datastore extension now allows an administrator to set up a vector data pyramid, and therefore significantly speed up WMS data serving over large data sets, especially those having geometries with a large number of coordinates.
The chart extension (previously mentioned on this blog) is contained in the release, allowing the overlay of typical business charts on top of WMS maps.
For Windows users, this version introduces a new service-based installer, making GeoServer run like any other standard Windows service, and allowing for easier administration.
And, as usual, a host of bug fixes (over 40!) have been incorporated into this release. Give it a try!
GeoServer 2.0, now in beta
The GeoServer Team is happy to announce GeoServer 2.0-beta1, the first beta release of the 2.0 series.
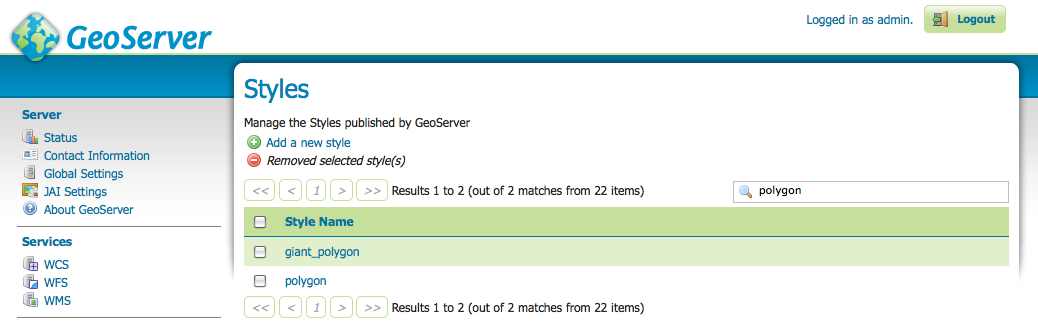
The primary focus of version 2.0 is the new user interface. This interface addresses many suggestions for usability improvements, including paging and filtering of lists of information, batch removal of layers, and the elimination of the Submit-Apply-Save workflow.
Another particularly useful feature added since alpha2 was released is cascading delete. This feature allows a user to remove a workspace or a data store and have all the entities contained inside (such as layers) also be removed. Previously, it was necessary to delete all layers individually before being able to remove a data store. To prevent unintended deletion, a confirmation page details what will be removed.
As usual a host of other fixes and improvements (over 100!) have also been incorporated into this release. Please download, give it a try, and forward your feedback along. We greatly appreciate reporting issues to the users mailing list and look forward to general feedback on the new user interface.
GeoServer chart extension
Business reporting is a common need in various organisations. Most of the time, it is built upon tables and simple charts, such as pie or bar charts. Yet, sometimes, you need to add an extra dimension into it, in particular, geographic distribution. In some cases a thematic map does the job nicely, but if you need to represent the composition of a phenomena relying on more than one variable, the result ends up being hard to read.
This is where the overlay of charts and maps come into play: the idea is to overlay bar chars, or pie charts, over a polygon or point map, associating each geographic feature with its own little diagram. As surprising as it may sound, you have been able to create such maps with GeoServer since a few months ago: by putting together the dynamic symbolizers feature and the Google Charts online API, it’s already possible to nicely overlay charts of top of a map. This works great in conjuction with the KML output, where the client has to go and fetch the chart separately anyways. However, it present some limitations in the classic WMS case:
-
you are depending on an external service that’s not under your control
-
if there is any missing feature, you can just ask and hope that next release will include that feature
-
rendering the charts requires remote calls, which will slow down the map rendering significantly, at least for the first requests
An open source solution, completely embedded in GeoServer, would guarantee control over the service availability, over its features, and provide excellent performance. David Gilbert, of JFreeChart fame, must have thought the same when he developed Eastwood Charts, an open source implementation of the Google Charts API.
The GeoServer charting module builds on top of Eastwood charts, bridging it with the dynamic symbolizers capabilities already available, to provide fast, in process charting over the map. Let’s have a look at an example built on top of the usual topp:states demo layer. We are going to depict the distribution of male/female population in the various states using pie charts, and to make the diagram more interesting, we’ll make the pie size proportional to the total amount of people in the state. Here is how the result will look:
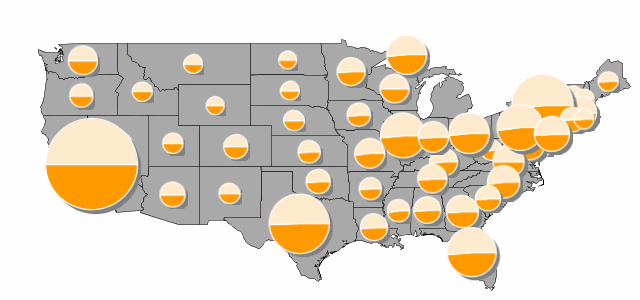
You can download the full style if you like, here we’ll have a look at the snippet in which the diagram is setup:
  <PointSymbolizer>
    <Graphic>
      <ExternalGraphic>
        <OnlineResource xlink:href="http://chart?cht=p&chd=t:${100 * MALE / PERSONS},${100 * FEMALE / PERSONS}&chf=bg,s,FFFFFF00" />
        <Format>application/chart</Format>
      </ExternalGraphic>
      <Size>
        <ogc:Add>
          <ogc:Literal>20</ogc:Literal>
          <ogc:Mul>
            <ogc:Div>
              <ogc:PropertyName>PERSONS</ogc:PropertyName>
              <ogc:Literal>20000000.0</ogc:Literal>
            </ogc:Div>
            <ogc:Literal>60</ogc:Literal>
          </ogc:Mul>
        </ogc:Add>
      </Size>
    </Graphic>
  </PointSymbolizer>
Let’s analyse the components of the ExternalGraphic call, which follow the rules of a Google Charts API call:
-
cht=p: the chart type is pie -
chd=t:${100 * MALE / PERSONS},${100 * FEMALE / PERSONS}: the chart data is expressed in “text” format, and in particular, the first value is the result of 100 * MALE / PERSONS, where MALE and PERSONS are two attributes of feature being rendered -
chf=bg,s,FFFFFF00: we state that the chart background fill is solid, white and… transparent. In particular, the color is expressed as RRGGBBAA, where AA is the alpha component, which controls transparency. In particular 0 is fully transparent, 255 is fully opaque
The size of the chart is controlled using the usual
We encourage you to download the chart extension and to explore its charting possibilities. You can use it with GeoServer 1.7.4, and can find out more about chart setup in the online Google Charts documentation (mind, a handful of charts and options are not supported by Eastwood, in particular, the Google-o-meter and the spider ones).
Let us know how that works for you!
Vulnerability
- GeoServer 2.26.1 Release
- GeoServer 2.25.4 Release
- GeoServer 2.26.0 Release
- CVE-2024-36401 Remote Code Execution (RCE) vulnerability in evaluating property name expressions
- GeoServer 2.25.2 Release
- GeoServer 2.24.4 Release
- GeoServer 2.23.6 Release
- GeoServer 2.25.1 Release
- GeoServer 2.25.0 Release
- GeoServer 2.23.5 Release